Blog
A data science blog for Petroleum Engineering.Topics covered
artificial-intelligence
artificial-lift
batch-automation
business-case
cloud
computational-physics
computer-science
conference
courses
data-driven-vs-physics
data-engineering
data-science
data-scientists
data-structures
datasets
deep-learning
engineering-library
fluid-properties
gas-lift
geology
geophysics
geoscience
latex
linux
literate-programming
logs
loose-questions
machine-learning
modeling
open-source-software
paper-research
petroleum-engineering
petrophysics
production-technology
prosper
pvt
python
r
r-package
reproducibility
reservoir-engineering
reservoir-simulation
seismic
shiny
spe
statistics
text-mining
tikz
to-do
transcript
virtualization
visualization-of-data
vlp
volve
webapp
well
well-data
well-logs
well-modeling
Subject ▸ python
Live applications of statistics in geoscience with Binder
Introduction This is a step-by-step guide on how to turn your Jupyter notebooks into live applications by adding a remote virtual machine running in my.binder.org. The virtual machine is automatically built in the background after you supply a list of the packages that your notebooks or scripts require. Motivation Although, my main objective was not writing, or develop, on how to convert Jupyter notebooks to running applications, but rather convert the Jupyter JSON format to Rmarkdown, and then be able to run them from remote sessions of RStudio and RShiny, it was difficult to ignore the value that live Jupyter notebooks would bring to Python users.A Python plotnine book built with Rmarkdown
Motivation Found this interesting article by Jeroen Janssens on applying the Grammar of Graphics introduced to data science by #rstats ggplot2. The amazing thing is that the article has been totally computed with Python as the coding engine, while the text is in Rmarkdown. The plots have been generated by the Python package plotnine, practically duplicating what R ggplot2 does! I liked the article so much that I decided to make it a “minimal book” with R bookdown, maintaining the Python computations.R and Python commingled: how to get the best of both worlds. Season 1, Episode 1
I confess. I have been in a long term relationship with … Python. Sometimes feels like 10+ years- other times like 15+ years, if I count my sporadic adventures with the language. Few years ago, I finally dared to explore other universes, and took the #rstats R route. I don’t regret it at all. It has been years of full productivity, challenges in learning the language, discovering its strong publishing tools (blogdown, bookdown, pkgdown, and the king of all: Rmarkdown), its science-oriented ecosystem, and, of course, making discoveries from data.Python, 3D seismic using segyio by Matteo Nicoli
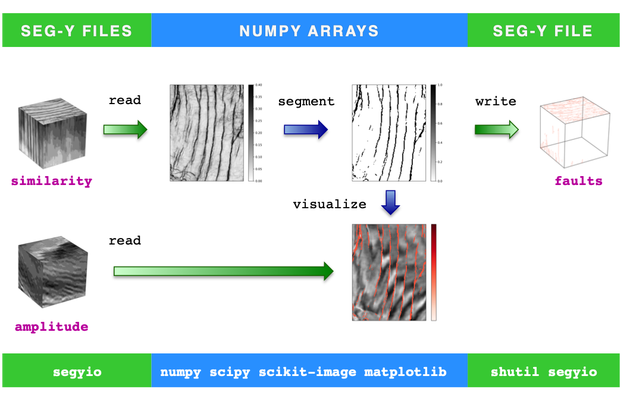
Found this interesting article in LinkedIn:
WORKING WITH 3D SEISMIC DATA IN PYTHON USING SEGYIO AND NUMPY (MOSTLY) by Matteo Nicoli. It comes with code, Python notebook and repository.
Keywords: segyio, seismic, python, notebook
References:
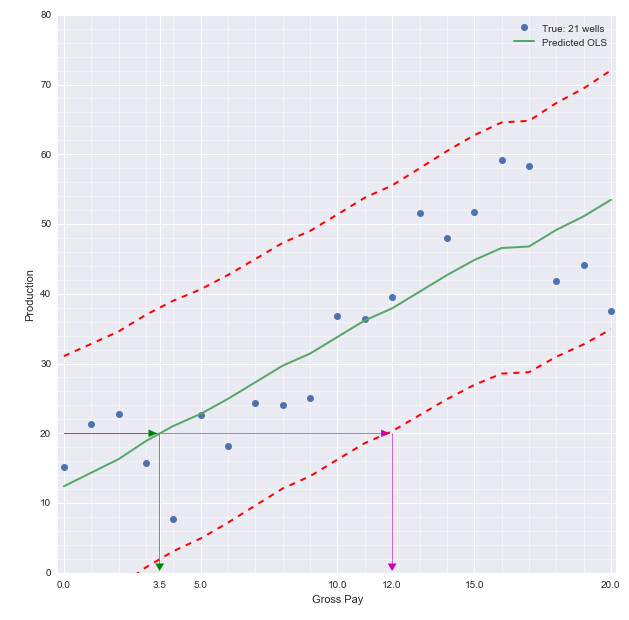
Calculate economic risk with regression using Python by Matteo Niccoli
Another reproducible example of regression using Python to calculate economic risk. By Matteo Niccoli (2017).
Keywords:
References
Python and PVT by Mark Burgoyne
PVT coded in Python!
Keywords: PVT, Python, phase behavior, EOS

