Introduction
Python and R offer a good combination of powers: dozens of proven engineering, data science, and machine learning libraries, also a science oriented approach towards full reproducibility. As I have told you before, I started my coding journey with Python many years ago. I even wrote a large application for production optimization using OpenServer, Prosper, GAP and MBAL by Petroleum Experts while I was on my 3-year tour with Petronas in Kuala Lumpur in Malaysia. I could have written the whole application in R but it was too big a challenge at that moment, and I needed to start coding immediately. R is very rewarding in many aspect of the data science workflow but the learning curve is very steep. Later, with more time, with no pressure of increasing oil production at those bad years of 2014-2015, I could dedicate more time to learning R.
Motivation
One of the main motivations for this work is spreading reproducible data science to my fellow petroleum engineers. When I say reproducible I mean as a minimum making code, dataset and repository available for others so they can make their own independent verification of your work.
Part of that mission was starting to work on the Volve dataset that was so generously donated to the public domain by Equinor. I don’t have words enough to thank to that pioneering decision. It will surely create avenues of innovation for data science, machine learning and artificial intelligence in petroleum engineering.
During the Volve reservoir model investigation I hit a huge roadblock: not counting with the appropriate tools to open the Eclipse binary files that are part of the output of the simulation. So, I went for the PRT file, which is a big file full of text also part of the simulation output. This file is fine if you are just doing a quick review. As you enter in more details and want to know more about the model, you feel you are missing lots of data: the data that is in binary format. Without the Eclipse software at hand, we have to get resourceful. The PRT was part of that but it started to give misleading and contradictory information. A reservoir engineer in the LinkedIn forums noticed a problem with the cumulative water between my dataframe readings and his Python binary conversion tool called pyrestools. He volunteered his code to confirm our suspicions, and we found that indeed, the data in the PRT file was incomplete on the aspect of the produced water, even though that cumulative oil had an astonishing deviation of 0.5% with respect to the historical production. In the following articles I will show where was the source of error in the water cumulatives, and we did to correct it.
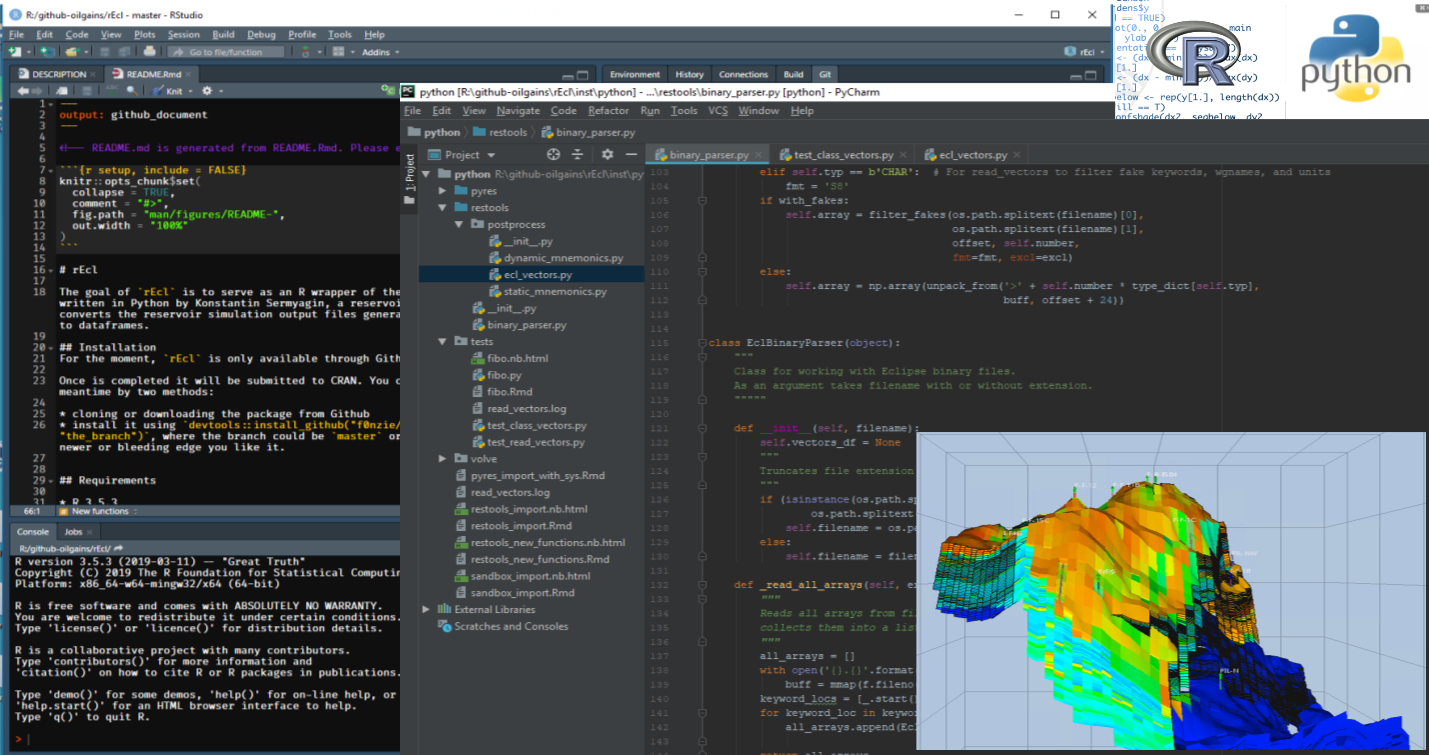
The main character: the Python class EclBinaryParser
All this integration between Python and R is due to these main reasons:
- I like more R for data intensive operations, besides I have all my development and data science reproducible setup to work with R and RStudio.
- There are very good Python libraries out there that we wish we could be using every day but they require that you to switch to a different environment.
- If the conversion of a Python library is possible, it would take days or weeks before we could have it available for our main purpose which is using the reservoir model data for history matching.
By integrating Python and R, we get the best of both worlds: abundant engineering Python libraries and a flexible scientific platform to attain full reproducibility which is R known for.
Thanks to the work of Konstantin Sermyagin, a reservoir engineer, who wrote pyrestools, is that today we are able to have this R package doing the binary file conversion to continue the work on the Volve dataset and the fabrication of the artificial intelligent agent.
Mingling of Python and R
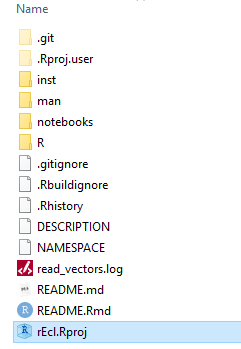
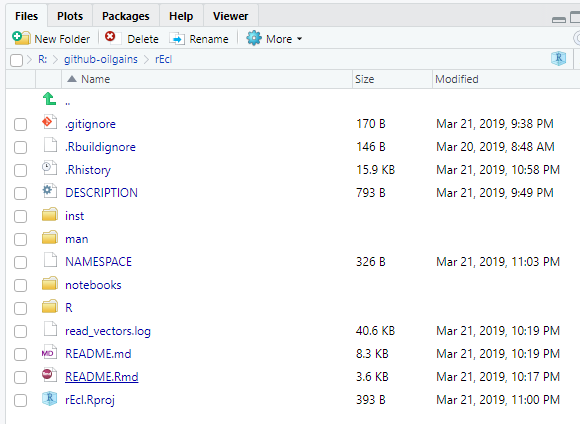
I am starting this series of articles on integration of Python and R by doing it with an R package. Why? Because it makes you more organized in your folder structure and the placement of the scripts and data files. This is the root of a project called rEcl:
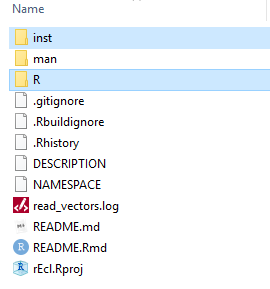
This is very typical in an R package. You may see additional folders but the structure is basically the same. This setup is very simple.
The Python files
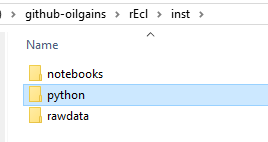
The Python files live under the folder I named python under inst. You can call it anything else, but I preferred this because it tells me immediately where the Python code lives. This is no mandatory but more of a suggestion.
 )
)
What you will see next is what resembles a Python project with several folders and files. The ones we are interested in now is the folder restools and volve. Don’t mind the other folders and files for the moment. We will explain them in few minutes.
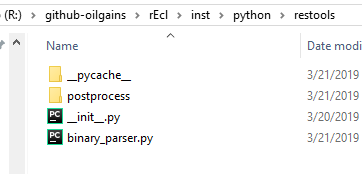
The folder restools is where our Python package resides. The main module is binary_parser.py. That script will call all of the rest Python submodules using import.
Python submodules
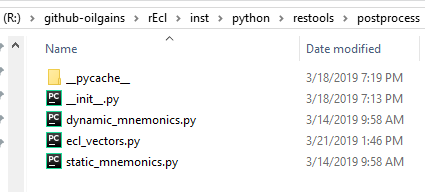
Another folder of interest for our reservoir modeling toolbox is postprocess. This folder contain additional Python modules that are used by the class EclBinaryParser.
Don’t mind much about them yet. You will have plenty of time later.
Now, our main goal is to get the package restools called from R to make use of all its classes, methods and functions. That’s the mission. If you can follow this workflow, you will be able to replicate this same structure for loading even more complex Python packages.
Unit tests
Another folder of interest is the unit tests folder tests. I know. You may not used very much to them but they are a must for robust code and reproducibility. Once you learn how to use them you will not be able to live without unit tests.
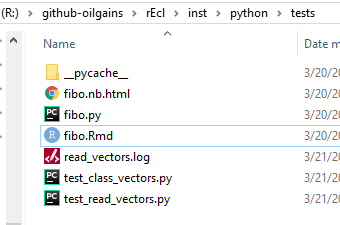
There are only two files here that contain few unit tests for functions that I added and also understand the output of existing functions in restools:
test_class_vectors.pytest_read_vectors.py
We will not do anything with them in this tutorial but you should know that they were instrumental for making this package work with R.
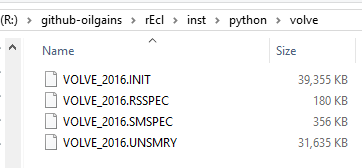
The Volve files
The Volve files from the Eclipse reservoir model execution are located under the volve folder. They are also in Github but they were excluded from the package rEcl because they were just too big. These are the Eclipse binary output files:
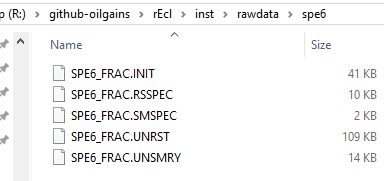
But because I wanted some files to test with, I included few files from the SPE6 reservoir model. They are much smaller, not as complex as Volve but they still serve the purpose of illustrating the conversion from binary files to dataframes.
Setting up the environment
In broad terms, we will install three main groups of software to get this working: (i) Anaconda Python 3; (ii) R 3.5.3 + Rtools 3.5 + RStudio 1.2+; (iii) PyCharm Community 2018.
All this software is open source and you can download them by googling the title of the application and the word download. All of them are easy to install in a PC with Windows 7 or Windows 10, preferably running at 64-bits.
I am not going to enter into the details of each installation because there are dozens, if not hundreds, of tutorials on how to install each of the applications.
Install Python Anaconda. I recommend Anaconda3 for 64-bits.
Create a Conda environment. You may call this environment pyres. That’s the name I am using anyway. These are the minimum requirements:
- Python 3.6
- Install pandas and numpy
- Optional: install the packages notebook and jupyter
The last two items can be installed from the Anaconda Navigator or from the Windows terminal corresponding to the environment we just created.
Install the R suite:
Install R 3.5.3. This is very easy. Just follow the instructions. At the end, select to add R to your path.
Install Rtools. Also simple installation. This will take care of compiling from source any R package.
Install RStudio 1.2+. This is not an official release of RStudio but rather a preview. I am using this version and is as solid as any of the production releases. The main reason for using this version is the interaction with Python scripts and Python chunks in Rmarkdown notebooks. The ability of sharing variables between Python chunks in notebooks is not available in RStudio 1.1.
Clone the R package
rEclfrom Github to your local drive. You can also download the package as a zip file. Unzip the file and put it anywhere you want. You can also leave it at your Downloads folder and do the rest of the operations from there.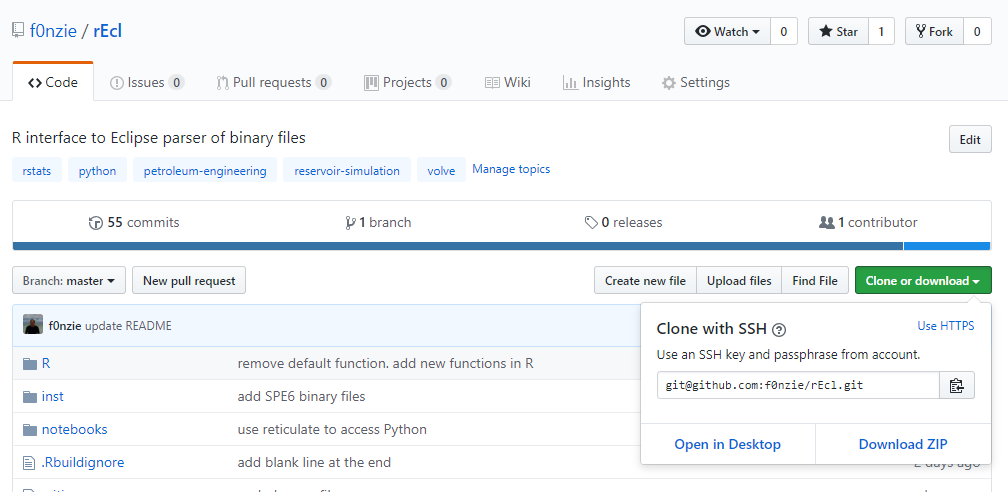
Once you have your folder with the package rEcl in order, double-click on the file
rEcl.Rpoj. If you have installed your R and RStudio, an R project will automatically open.
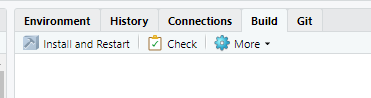
You will build the package from the RStudio interface by clicking on Install and Restart on the Build tab as shown in the figure.
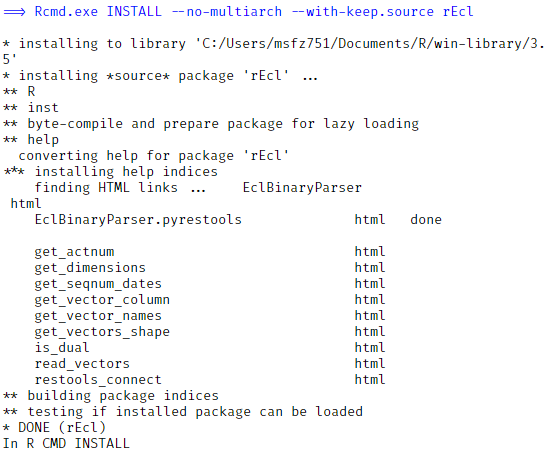
RStudio may ask you to install some dependencies. Accept that and continue with the installation. You should see some results like this in the figure, showing that everything built fine. At this moment you have the R package installed.
Remember that one of the first steps was installing a Conda environment pyres with just two dependencies:
numpyandpandas. The first thing we will do is testing theREADME.Rmdfile.
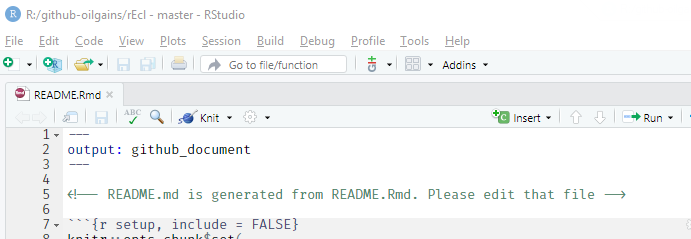
This is at the root of your package project.
Click on it and click on the icon Knit:
- If your Python environment was correctly installed you should see the README building as a HTML file.To learn how to use rEcl, read the README :) and follow the examples there. There are two reservoir models: SPE6 and PUNQ-S3. Once you get familiar with the workings of the package, you will be able to move to you real reservoir model.
References
A. Firoozabadi (Norsk Hydro A/S) | L. K. Thomas (Phillips Petroleum Co.), 1989. “Sixth SPE Comparative Solution Project: A Comparison of Dual-Porosity Simulators”. SPE-18741
Standard Models, Faculty of Engineering, Imperial College London, PUNQ-S3. URL: https://www.imperial.ac.uk/earth-science/research/research-groups/perm/standard-models/
Duggan, J. 2018. pysd2r. CRAN R package. https://cran.r-project.org/web/packages/pysd2r/index.html
Gosiewska, A. 2019. shapper. CRAN R package. https://github.com/ModelOriented/shappe
Kelly, T. 2019. leiden. CRAN R package. https://github.com/TomKellyGenetics/leiden
Floris, et-al 2001. “Methods for quantifying the uncertainty of production forecasts a comparative study”. Petroleum Geoscience, Vol 7 2001, pp. S87-S96.