I have to confess my sin. I am coming from writing thousands of lines of Python code for a well modeling and optimization project. I did Exploratory Data Analysis (EDA) for the resulting well models and applied statistics using Python, pandas, matplotlib, SciPy and NumPy. I went full throttle and didn’t look behind. Got the results, the production engineering team increased the oil production we were looking for. All went fine, with the exception of being at fault for not exploring the other alternative: doing the work with “R”. If you haven’t heard about R you are missing the fun of the 21st century: data science.
I might not be totally to blame though. Python is a relatively easy to learn scripting language, fast prototyping applications and producing quick results. Also, it has under its domain pretty good engineering and scientific tools. Like the ones I cited above. Plus the statistical and machine learning packages that have been flourishing over the years.
On the other hand, there is R, another programming language with the peculiar feature of having been invented by statisticians about couple of decades ago. R is the preferred open-source language when it comes to publishing research, doctoral papers, statistical analysis, supervised and unsupervised machine learning, regression analysis, forecasting, exploratory data analysis, multivariate plotting or visualization.
R can be intimidating. Didn’t I mention that its users are mostly PhDs? R is different of any other language I have seen over the years. And that comes, I believe, from its intense focus on the data, data analysis, statistics and vector oriented operations. After few months spent on learning and working with R, I can tell you that any sweat was worth every penny. It is not only the language itself but the whole R ecosystem that surrounds it: the data types abstraction; the fact that can be run in interactive mode from a console, or by scripting automatic operations; the enormous plotting capabilities; its solid library of packages that always runs; that can easily integrate with lower level languages such as C, C++ or Fortran. Besides, R practically reads and writes any possible data format or database.
Plotting. The plotting capability is embedded in the base system itself. One of the major strengths is visualizing the data to make sense when there are millions and millions of numbers. No other language gets closer to that power. If you have tried C++, Python and Java you will have to end up searching for libraries and still will have to do a lot of leg work to get your plot right. Not in the R world . Besides the base plotting there are other powerful packages that even add a grammar of graphics such as base or ggplot2 or lattice or ggvis which make R unique.
Packages Quality Control. Publishing a package in R, sort of has become a badge of honor due to the rigorous requisites and numerous rules you have to comply with to make your package available to its repository CRAN. And I think for a good reason, R has kept kept solidly growing and giving reliable results. And it is on the subject of reliability where the major separation between R and Python starts to be noticed. If there is something that the Python community has to do to is improving the reliability of the code; maybe by applying more rigorous standards to the package development and publishing. Today, there is not only two major Python versions out there competing: 2.7 and 3.5, but package compatibility varies from distributor to distributor. An application developed using Python vendor X will not run without hiccups or crashing in A or E or vice versa.
Speaks C, C++ and FORTRAN. Java too. I think this is the one of the characteristics that caught more of my attention during my R exploration. If there is a challenge in engineering, it is to make the applications faster and memory efficient. C++ and FORTRAN bring that besides the enormous baggage of scientific libraries, proven and tested. I tried it with calls from R to C, C++ and FORTRAN and they just work without touching your environment settings in the operating system. I have tried in Windows, Linux and Mac-OSX, and all of them compile without needing an IT guy or Admin wizard at your side. R makes an amazing and effective engineering tool. I even tested calling math and physics libraries from Java.
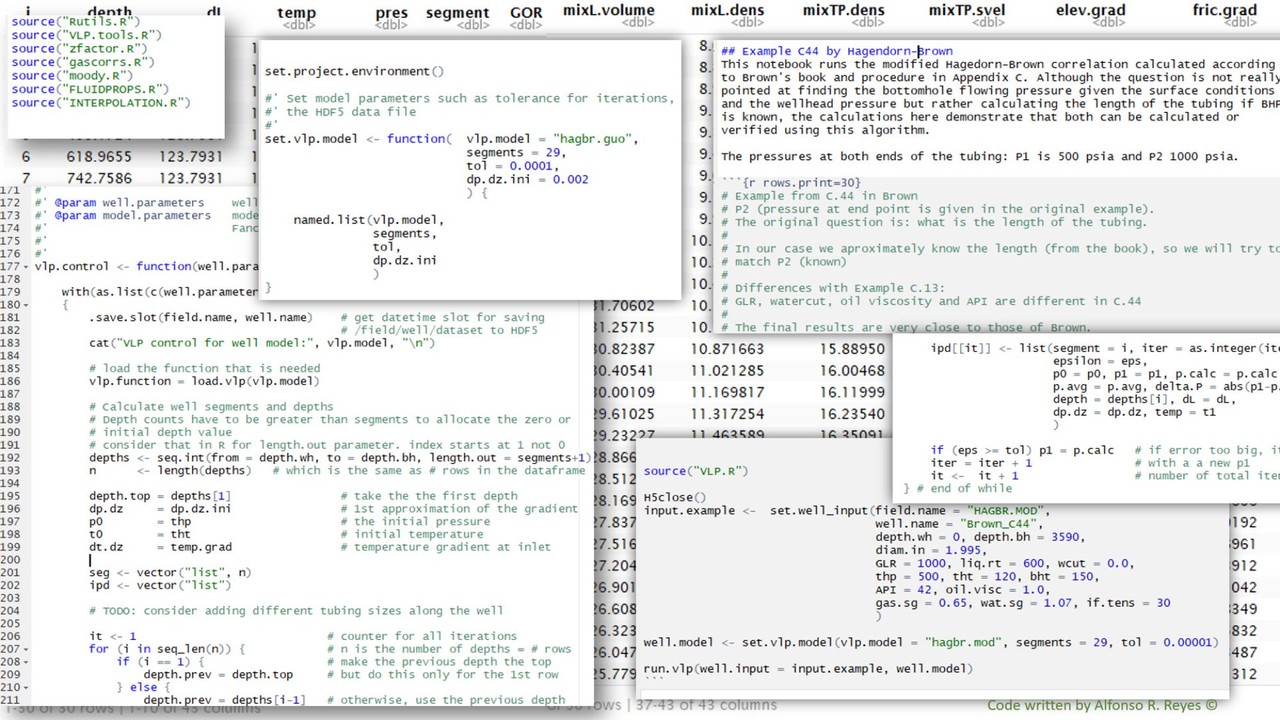
Reproducible. This is a concept we may not have seen often in the petroleum industry. And that is possible due to our extreme reliance on spreadsheets. Everybody likes getting quick results. Don’t get me wrong. But the same characteristic of formulas and cells that has made the worksheet the king, it is at the same time, its major weakness. You cannot replicate safely the results unless you look at and revise the formulas cell by cell. You will never be sure that anything has not been improperly copied and pasted. And that’s a big problem. Spreadsheets nurtures bad data habits. I think it is here where the great influence of biomedicine, biogenetics, biogenomics and similar branches of the bio sciences play a vital role because they cannot afford any mistakes. The work of a researcher has to be able to be reproduced by colleagues or third parties before publication of the conclusions. The whole R environment has been molded in that way. The results should be the same -based on the same data-, regardless of who was the person running the analysis. Besides the benefit of repeating the analysis in the future leaves lessons for others to learn. Reproducibility goes hand in hand with version control and publishing.
—> insert image
No need for GUI. It must be the data-centric nature of R, and its focus on the statistics, that doesn’t make you miss a graphical user interface. So, let’s say you are tremendously happy that you can produce your analysis, plots and report that you forget that you need a window with buttons, dialogs or menus. You are busy with the data, the calculations, the algorithms and the statistics without paying attention to the bells and whistles of a fancy user interface (UI). The folks from RStudio -one of the R vendors-, came up with a beautiful model for the graphical interface, browser based, and its name is Shiny. I heard about it. Got worried: here comes another HTML, JavaScript, CSS tool to learn. Nope! Wrong! They have made possible an abstraction of the whole graphical construction to just simple use of R code. I remember producing my first graphical statistical application, with sliders and all, in approximately 5 minutes. It’s easy even if you don’t know much R; like I was few months ago.
—> image
Why not everybody is using R then?
R is hard. It looks different because it does things differently. I remember taking a look at my first book of R and thinking “rather do then my project in Python …” R exhibits a unique level of abstraction when it comes to the way of manipulating the data; it doesn’t resembles much of Python, or much less of Visual Basic. The best and most efficient operations are performed using vectors and it is heavily discouraged -but not forbidden- to use loops to perform iterations. Rather be using apply, lapply, sapply or the other apply functions. Getting out of the loop - no pun intended - possibly, is one of bad habits harder to break. It takes a while to get accustomed to the functional programming demands of coding in R. But it is neater and one gets amazed that one line of code can do so much to summarize a huge data table and replace nested “for” loops.
The bottom line. R, and the other scripting languages available, will always make your engineering and data science results better, state-of-art, reproducible, shareable, version-controlled, with publishing quality and with much, much better plots than the canned worksheet graphics, which by the way, haven’t changed much for the past 25 years.
You can follow me via Twitter via fonzie@OilGains