One of the big challenges of this new era of data science. machine learning and artificial intelligence is getting unhooked from the habit of working with spreadsheets. They have been around for 30+ years and were awesome. But spreadsheets - or worksheets - do not scale well with massive amounts of data; or continuous streams of data; or other characteristics that are key for taking good and sound decisions such as reproducibility. Besides, spreadsheets have not kept up with the times so we have seen the plotting capabilities getting very much behind of other software.
Plots are the most expressive way that you can show your data and analysis.
This time we will start with some well raw data. This data is part of the input data that we require to create well models for nodal analysis, production optimization, IPR/VLP calibration with well test data, troubleshooting, plan a stimulation job, or reviewing the well technical potential. In my case, this data was input for Petroleum Experts’s Prosper. But the same could have been used with Schlumberger’s Pipesim, or any other.
Again, we will use R for these tasks. What we will do is:
Read the Excel data into R Perform a basic statistics on the raw data Find problems with data: data missing or improperly entered Deal with missing data and correct typing issues Convert the raw data to tidy data before analysis and plotting Save the tidy data See what story the data is trying to tell us Present our discoveries Setting the stage In order for you to be able to reproduce this analysis, you will need to install R, Rtools and RStudio. They are very easy to install. And the best of all, they are free.
Don’t be mistaken. This is high quality software that will lead you to a world full of discoveries. So, I am assuming that at least you have installed R and that you already have your RStudio screen in front of you. This is supposed to be a sort of introductory session to R, so, I am assuming that you have little or no previous experience with R either. If you are an experienced user, you will skip to the end very quick.
Remember, R has been designed by scientists for the use of scientists and engineers. It is not only a tool for discovery but for development. I showed a little bit of it with the article on the compressibility factor.
The Raw Data We will start by reading the raw data. Raw data is data as-is. It hasn’t been cleaned up or checked or organized. Although this raw data has had some treatment to allow us focus on the main goal. You will have access to the raw data via GitHub. I will publish all the material there: raw data, datasets, scripts, notebooks, etc. I may even publish a R package to make the installation much easier for you.
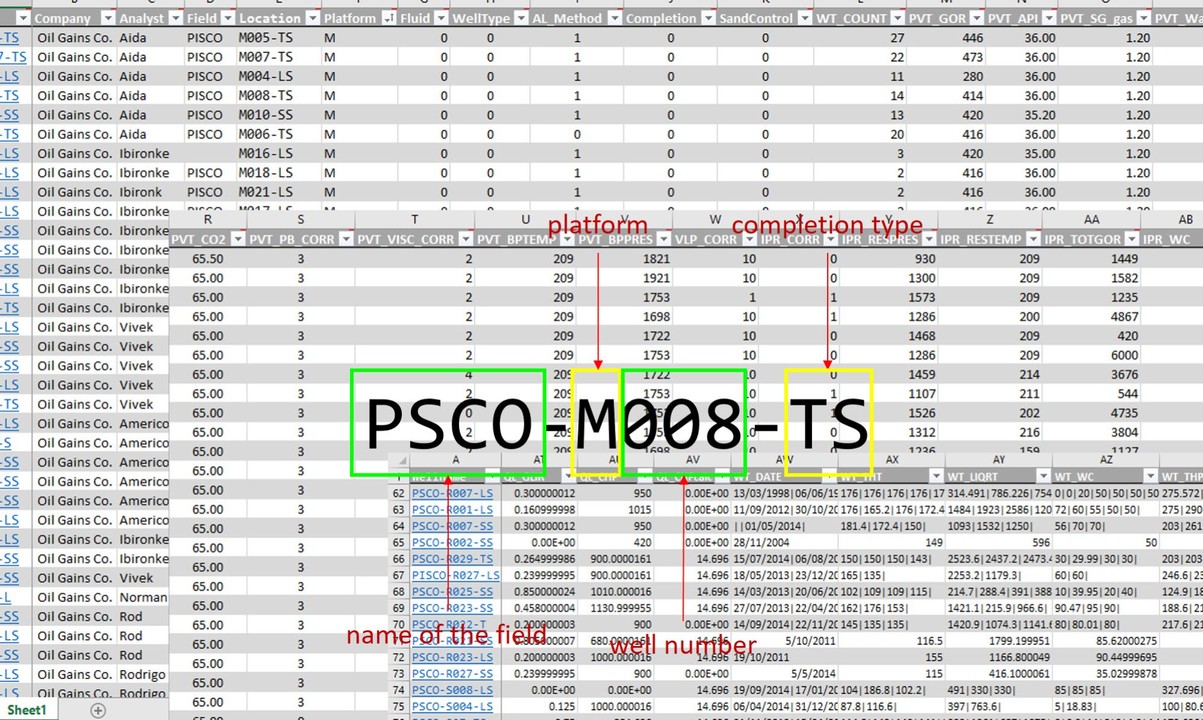
The raw data is to be used for input in 100 wells. This input data is the minimum required to create a well model under any nodal analysis software. The well data could be grouped as: general data (well name, field, platform), well type data (fluid, completion type, artificial lift method), PVT data, IPR data, VLP data, completion data (deviation survey, tubulars), geothermal data, gas lift data (for those wells that have artificial lift), and well test data.