As I prepare to release couple of examples using Generative Adversarial Networks (GANs) for creating synthetic datasets using rTorch, I found that I have several Rmarkdown notebooks loose out there while learning PyTorch. So, I decided to put these notebooks in a sort of an online ebook in GitHub. These notebooks range from unit tests for testing functions I implemented in *rTorch*, a wrapper of PyTorch, written in R, to small neural networks for logistic regression and linear regression. It is basic material but enough to get the curious petroleum engineer started.
A Minimal rTorch Tutorial
I have called the first of these ebooks “*A Minimal rTorch Tutorial*”. I am making it public today. Still working on it, trying not to make it too complex, I decided to move the more elaborated notebooks to another collection that I may call “Advanced rTorch for Machine Learning”. This one is still in preparation.
Motivation
With so many PyTorch and machine learning tutorials in the web, what makes this new one different?
First, it is written in R and Python at the same time. Today, thanks to the R package reticulate, we can combine R and Python code together in the same notebook. Still, you may say, you can do this in Jupyter (the Python notebook). Yes, you can, but Jupyter notebooks are not reproducible because they are not fully readable and written in JSON. The *Rmarkdown* notebooks give you that freedom and flexibility of being able to read your notebook directly, and also applying version control with Git, essential in any data science or machine learning project.
Second, you will be able to enjoy a simultaneous R and Python environment for machine learning. Why? Because the package rTorch provides Python core functions, and exposing the packages numpy, pandas and matplotlib as modules within R. This gives you the enormous advantage of copy-pasting machine learning code in PyTorch to analyze the output using R data structures and plotting goodies.
Third, PyTorch is one of the easiest to learn machine learning libraries today. Right away, without further distractions or abstractions. That puts at your disposal thousands of machine learning snippets of code to experiment.
Fourth, you can combine Python and R code together and make your own R packages. I will go deeper on that subject in another article. But this feature represents a efficiency multiplier of your data science toolbox as well as of machine learning. You will find that sometimes is more convenient to call directly a Python script or module or class, rather that rewrite it in R.
Fifth, I chose PyTorch, as the preferred library to do research of machine learning algorithms focusing on petroleum engineering applications. There are other machine libraries available in Python and R, of course. After some research and experimentation I found that PyTorch is not only easier to learn but easy to install and implement in the real applications. I wrote on top the rTorch package which gives me the best of both worlds.
Why are you so focused on Generative Adversarial Networks (GANs)?
While I continue to develop algorithms in R, for instance, the GANs for creating synthetic datasets out of real oilfield data, I will progressively make them available via GitHub for anyone looking to use them on practical applications. The main goal of making GANs widely available and easier to deploy to the petroleum engineering community is to enable a revolution of sharing datasets without compromising confidentiality of the assets. That is what synthetic datasets are about.
Enough talk. Give me the code
Then, there it is: here is the link to the first online ebook called “A Minimal rTorch Tutorial": https://f0nzie.github.io/rtorch-minimal-book/. This other link belongs to the source code: https://github.com/f0nzie/rtorch-minimal-book.
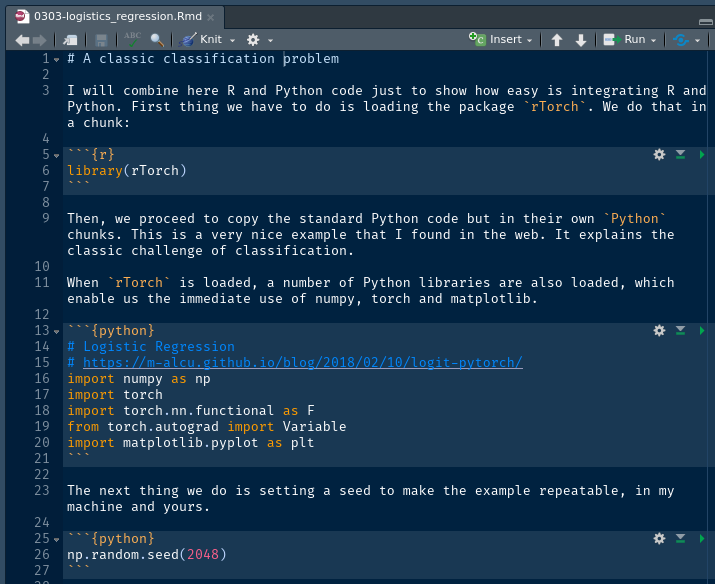
Example of Python code in R
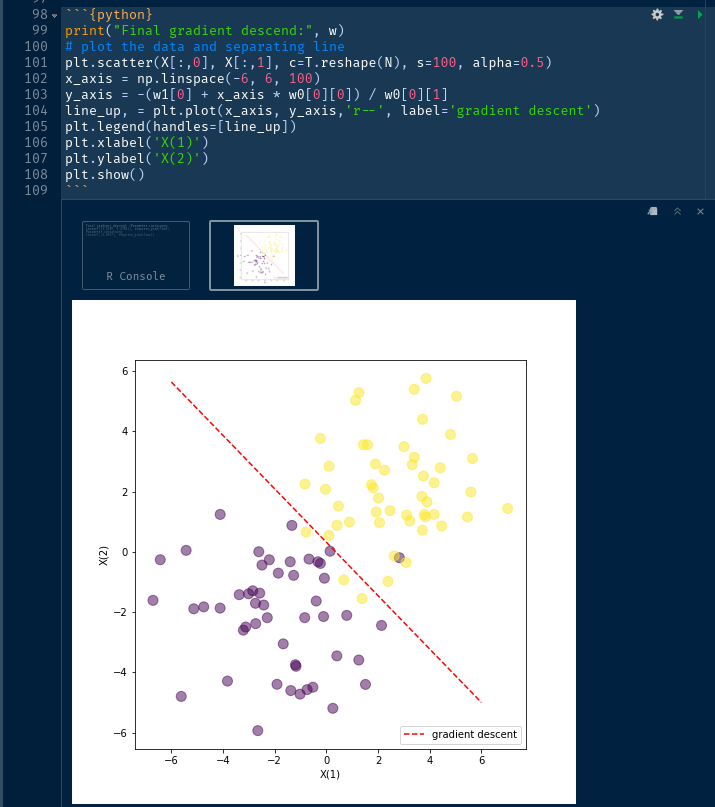
As an example, let me show you this classic of logistic regression for classification. This is Python code in a Rmarkdown notebook. Notice the combination of R chunks and Python chunks.
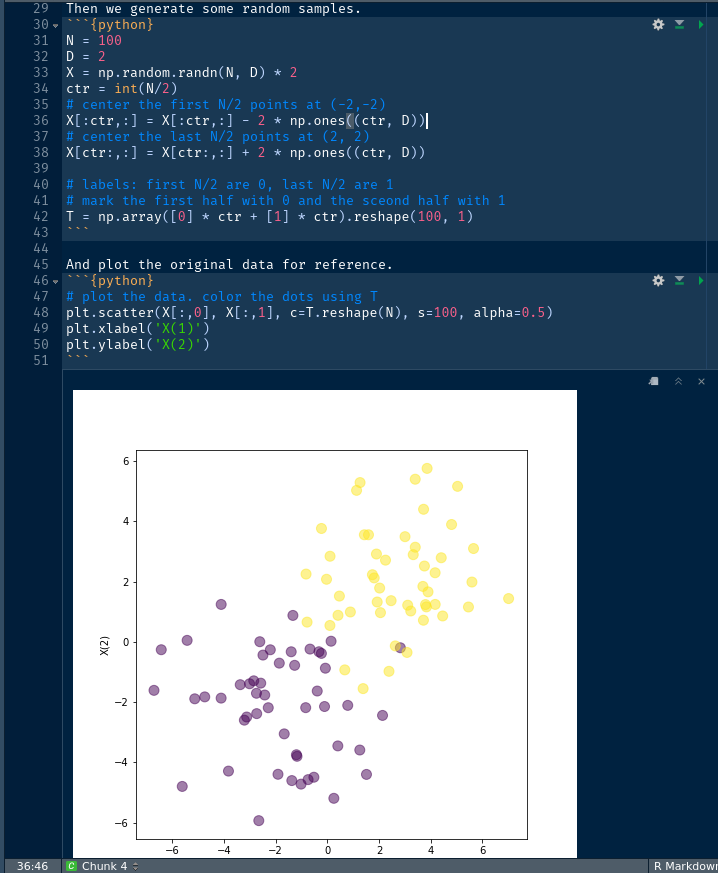
We then generate some random data and plot it for reference. Note that we have chosen matplotlib, but we could have also plotted it with ggplot2.
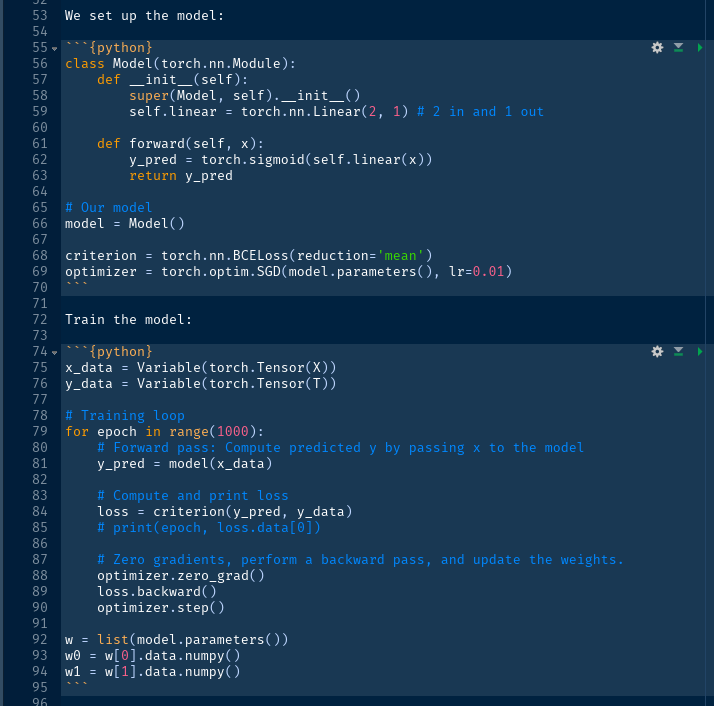
What follows is the definition of the model using a neural network and train the model. We still are inside the R environment.
Finally, we plot the results, by tracing the line that separates two classes, 0 and 1, which are both colored in the plot.
Although, we have used in this example almost all Python code inside an R environment, we could have chosen to write the algorithm in R as well. We will see later more examples where we make use of R data structures.
See also