One of the first concepts that one learns when working with data is rearranging raw data into tidy datasets. A tidy dataset not only means having the data in a row-column format but in such a way that a row corresponds to an observation and a column to a variable. This facilitates enormously the analysis. I know this could sound a little bit confusing, so I will show what raw data and tidy data looks like with an example.
I am working on a new gas compressibility correlation using neural networks and found that the digitized data from the original Standing-Katz curve was in non-tidy format. The original file is in Excel. You can find it here. Here is a screenshot of how the table looks:
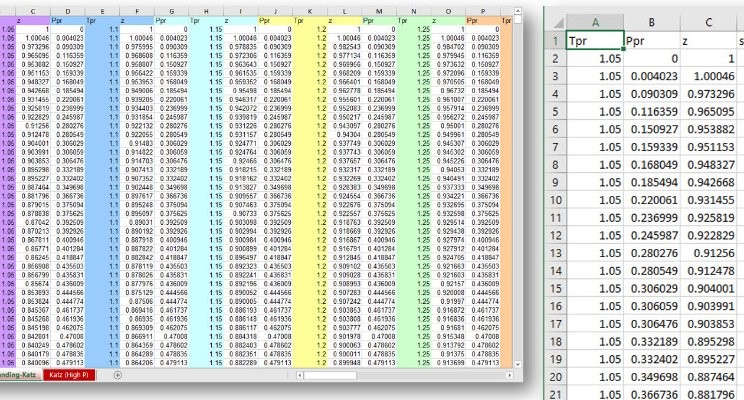
# insert picture ds_for_pe_6_tidy_data-01.jpgWhat you see here is the data formatted in a multi-columnar format. There are 2,853 rows and 60 columns. Every three, the columns that repeat are Ppr, Tpr and z, where Ppr is the pseudo-reduced pressure, Tpr the pseudo-reduced temperature, and z the compressibility factor. What we can see here, in this raw-data format, each set of three columns corresponds to a Tpr curve; column B corresponds to Tpr=1.05, column E to Tpr=1.1, column H to Tpr=1.15, and so on, up to Tpr=3.0. Multi-columnar is a nice format to see many values at once but for data analysis is not so useful.
Using some R magic ( (not to worry, I am providing all the code and data. Find the repository link at the bottom):
# codeI transformed the multi-columnar format table above in something like this (it is a CSV file generated from R. That dispense us from using spreadsheets from now on) :
# pictureYou can see the difference now, right? One column for one variable, and one row for an observation. That’s the rule.
Now, our original raw data has transformed into a tidy format table of 57,060 observations and 4 variables Tpr, Ppr, z and set number. We couldn’t have called observations and variables to the rows and columns of the original raw data because (1) the “observations” in the multi-columnar table cross each other; (2) the values of the 60 Ppr, Tpr and z “variables” that repeat again and again belong to the same three variables. Here is the tidy data CSV file.
With any data in tidy format is much easier to perform exploratory data analysis and generate plots.
Remember, one observation is a row and a variable corresponds to a column.
If you want to learn more about tidy data, you can find excellent advice here: Hadley Wickham’s tutorial, or his online book on data science with R.
You can have access to the raw data, code and tidy data in this repository zFactor.DL at GitHub.
You can follow me via Twitter via fonzie@OilGains