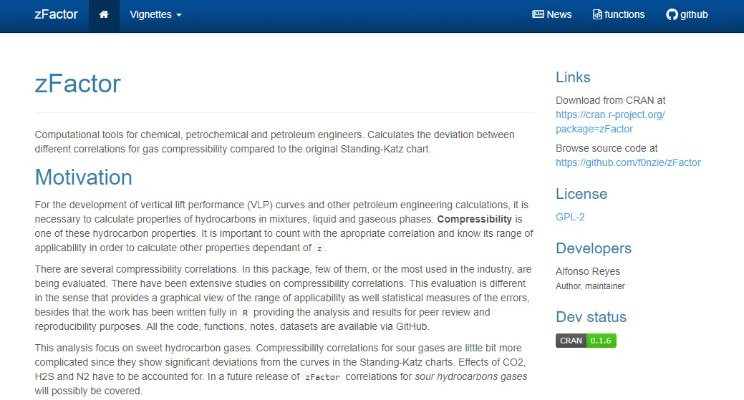
I just upgraded the package zFactor today. I added a new feature that converts the entire R package to a website to navigate through its pages of analysis and report. In fact, it was very simple. There is a package called pkgdown that turns any R package in a website using the same GitHub repository.
To access the zFactor package as a website just click on this link:
https://f0nzie.github.io/zFactor/
If you recall, zFactor makes a comparison among the most used compressibility factor correlations for hydrocarbon gases. here I am showing just two of them:
# plotThe blueish it is, the most accurate at that range. MAPE is the Mean Absolute Percentage Error. Each of the correlations has its own table of statistical errors for comparison.
What you can do with zFactor
- Find z with any of the correlations provided
- Get values from the Standing-Katz chart at any of the isotherms limited by the pseudo-reduced pressures (Ppr) digitized
- Find what isotherms or pseudo-reduced temperatures (Tpr) are available from the Standing and Katz chart
- Find what pseudo-reduced pressure points are available
- Plot any of the Standing-Katz isotherms to view z in graphical form
- Plot a tile chart to show the range of applicability of the correlations. In essence, get an idea of the accuracy by the location of the desired point at Tpr and Ppr
- Get a statistics table when comparing any of the correlations to the Standing-Katz chart
- Get a matrix of z values calculated from any correlation where the rows are the pseudo-reduced temperatures and the columns the pseudo-reduced pressures
- Plot one or multiple isotherms
If you want to learn more about the package you could go and click on Vignettes where you will see these additional articles:
# figureIn the next days I will be submitting the latest changes to CRAN (the Comprehensive R Archive Network).
All the code, functions, notes, datasets are available via GitHub. Just click on the GitHub icon on the right of the menu bar.
# figure