Introduction
Inspired by a post by Fernando Ruiz at LinkedIn on an Artificial Lift tool this morning, I decided to dust off an old Excel workbook containing an old matrix with various design aspects of artificial lift.
Motivation
The objective of the tool is providing a quick way of analyzing the applicability of the different artificial lift methods. At present, it is not a rigorous application because the criteria is limited by the engineer’s bias. Your oilfield may be a completely different demands as well as totally different design criteria before proceeding to select and deploy an AL system.
Access to the Web Based Application
This Artificial Lift Selection Tool is web based and can be opened in your local browser. It can, of course, also published in a public Shiny server. Here is a link to the live application https://oil-gains-analytics.shinyapps.io/al_flex/.
How the sauce is made
The first steps was reading the workbook with R and then convert it to a tidy dataset with the help of the package tidyR. Second, was cleaning up the names of some the criteria values that contained special symbols, such as the degrees circle, the chevrons that sometimes replace the normal text quotes, remove spaces from the columns or variables replacing by dashes, etc. You can see the whole operation in this piece of code:
insert code hereAt the end or the article, you will find the link to the whole code and data of this application.
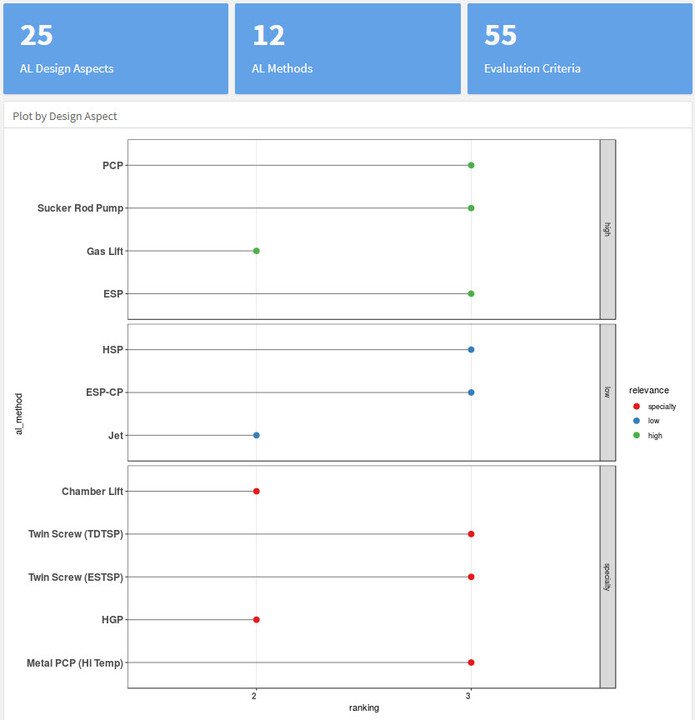
The third step was finding the right type of plot for showing the discoveries brought by the selection tool. I chose a combination of scatter plot, adding segments and finally presenting it with the help of facets. To be honest, I am not totally satisfied yet with this only one plot. Later, I could come up with a better plot or plots.
The fourth step was making the selection dynamic using selection inputs from R Shiny, a web publication tool from RStudio. I used one of the frameworks provided by Shiny, the simplest one, called flexdashboard. This would be the, in my opinion, within the level of rapid development for an engineer, since it does not require a deep knowledge of coding. Engineers just want results, right?
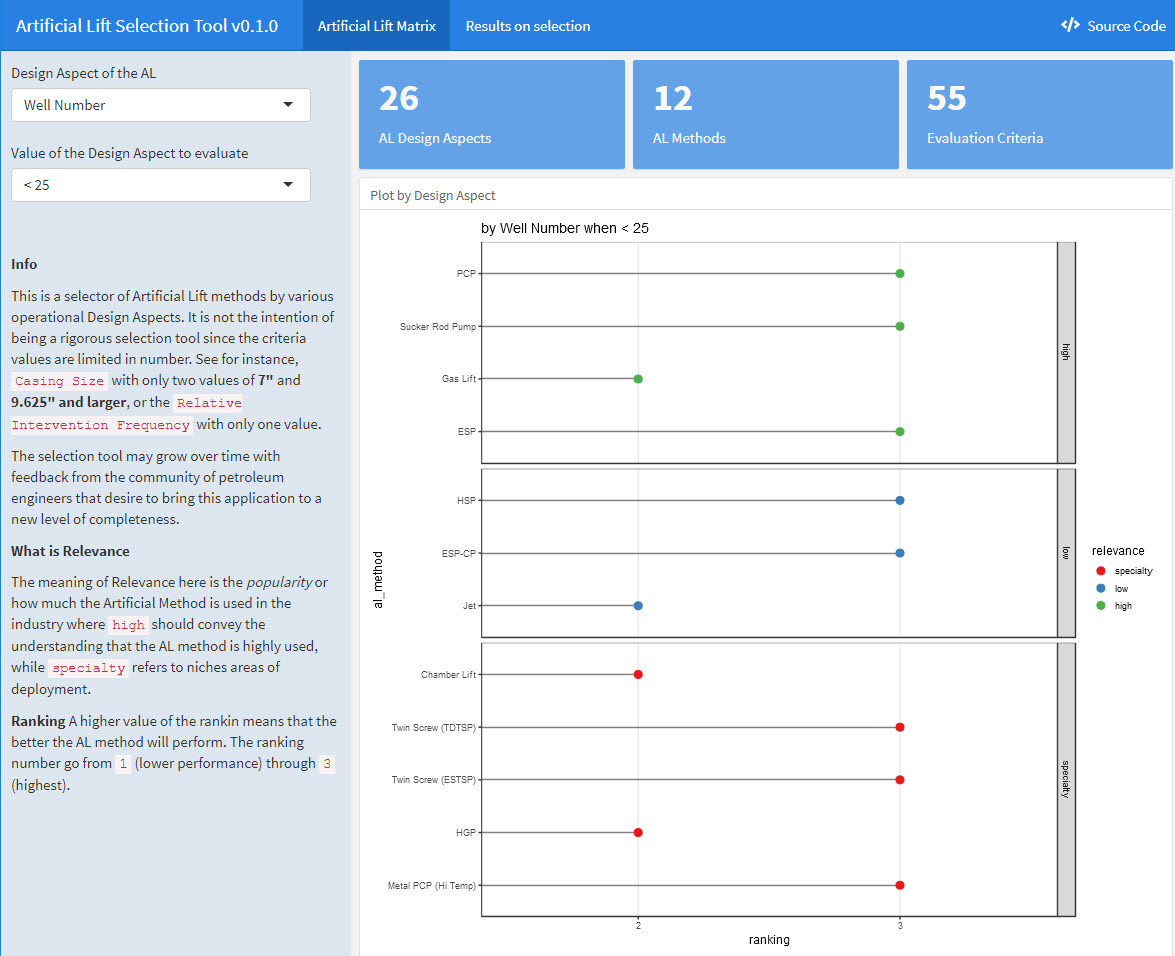
The fifth step was putting together the selectors, tidy dataset, the plot, the tables, and some value boxes that summarizes the data. You can see below a screenshot of the Shiny app.
Inputs of the AL Selection Tool
The inputs correspond to Artificial Lift methods by various operational Design Aspects. It is not the intention of being a rigorous selection tool since the criteria values are limited in number. See for instance, Casing Size with only two values of 7" and ‘9.625" and larger’, or the Relative Intervention Frequency with only one value.
The selection tool may grow over time with feedback from the community of petroleum engineers that desire to bring this application to a new level of completeness. It possibly will require adding additional Design Aspects and corresponding evaluation criteria.
Relevance and Ranking of the AL Method
What is Relevance: The meaning of Relevance in the tool is the popularity or how much the Artificial Method is used in the industry, where high should convey the understanding that the AL method is highly used, while specialty refers to niches of areas of deployment.
Ranking: A higher value of the ranking means that the better the AL method will perform under that criteria. The ranking number goes from 1 (lower performance) through 3 (highest).
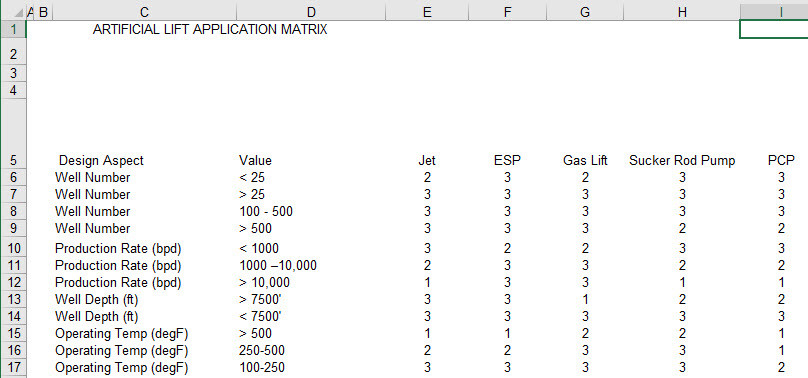
AL Matrix Datasets
If you are wondering how the Artificial Lift matrix data looks, this is a screenshot of it:
This is other table, which corresponds to the tidy dataset, is much different, because the variables or columns, have been “gathered” to conform to the tidy format, which means one column represents only one variable. This is a screenshot of that tidy dataset of the AL matrix:
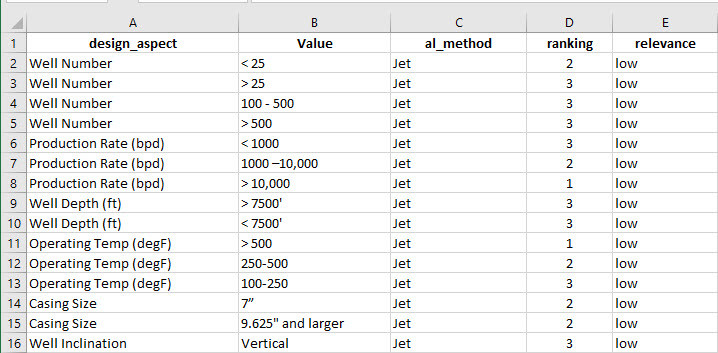
You will be able to have access to both datasets in the folder inst/extdata. Both are saved in Excel format for your convenience.
Open Source, GitHub and access to code
You can find the code and in the following GitHub repository: https://github.com/f0nzie/artificial_lift_matrix
Join me in Twitter: https://twitter.com/OilGains